")


If you think of we live in a pretty laid back place, there is some interesting social science that backs up that observation.
Michelle Gelfand, a professor at the University of Maryland, and her colleagues have developed the idea of “tightness” and “looseness” in societies, and have noted the variation in these qualities around the world and within the United States1.
A tight culture has more strongly enforced rules and less tolerance for deviance, while a loose culture has fewer strongly enforced rules and greater tolerance for deviance. After studying survey responses in subject areas, researchers plot countries and regions along a continuum of tight and loose, assigning an index score. A low index score indicates looseness, and a high index score indicates tightness.
Figure 1 shows the index scores for the 50 states in the U.S.
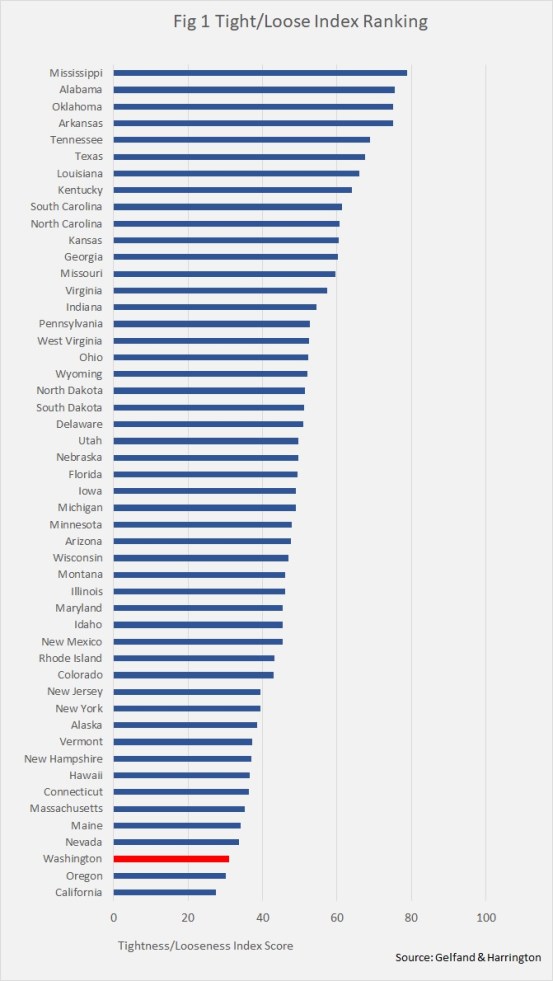
Washington is the third loosest state in the country, exceeded in looseness only by Oregon and California. The balance of the top ten loosest states are in the far west or New England. At the other end of the spectrum, all of the ten tightest states are in the Southeast.
These findings fit with common stereotypes of cultural norms in the West and Southeast. The West is seen as a place of individualism, tolerance and pragmatic norms, while the Southeast is seen as holding tighter to traditional norms and social strictures.
Tight/loose and social outcomes
So, how do these observations play out in the real world? Figures 2 through 4 show a series of correlations of the tight/loose index with social measures. The red dots represent Washington State.
Because the tight/loose concept centers on social norms, religiosity would seem a useful place to start. We would imagine that cultures adhering more to religious practice will tend to emphasize longstanding social norms and view changes in those norms with some skepticism.
Figure 2 shows that to be the case. The measure of religiosity is taken from a 2016 study by the Pew Research Center. The study combined four measures of religious practice into a single measure of the degree to which adults in each state identify as highly religious. The correlation of 0.74 is quite high, giving religiosity strong explanatory power with respect to tight/loose. Washington, as has long been noted, is among the least religious states.

Another logical hypothesis would center on education. We could imagine that more educated people would tend toward the loose end of the spectrum, as education is believed to encourage broader thinking and to expose people to different ways of arranging their lives. Figure 3 shows the correlation between the tight/loose index and the share of the population that has at least a four-year college degree.

In this case, education has some explanatory power, but less than religious practice. However, removing just three outliers—Virginia, West Virginia and Nevada—brings the correlation up to 0.49, which is fairly strong.
A third clue that might explain the tight/loose score is the degree of mobility within the population. We might think that societies with stable populations would tend to resist change. Figure 4 shows the correlation between the tight/loose index and the share of the state’s population that was born in that state.

In this case, though, the correlation of 0.20 is fairly low. Causality may run both ways. New people coming to a state might bring new ideas, but a state with a certain culture may attract new residents who find that culture compelling and will have no interest in changing it.
This “sorting” pattern has been noted by scholars. Mobility in the 21st century may be as much about finding culturally compatible surroundings as finding economic opportunity. A footloose person who is most comfortable in a tight setting may head to the booming cities of Texas, while a person who prefers a looser atmosphere may head to the cities of New England or the West.
Tight/loose and economic outcomes
Figures 2, 3 and 4 point toward causality in the direction of tight/loose, suggesting ways that existing cultural factors might drive the tight/loose score. But we can look at causality the other way, and see if the tight/loose score is associated with any outcomes.
Figure 5 illustrates the relationship between tight/loose and overall population growth.

There is no correlation at all. It appears that both tight and loose states can grow and they can both stagnate. Since a large share in the variation in growth rates among states is due to migration, this finding is consistent with the weak correlation between migration and tight/loose seen in Figure 4.
It would be reasonable to think that tight/loose may correlate with productivity and income. High growth industries rely on innovation, and innovation would be associated with loose cultures. Figure 6 shows the correlation between tight/loose and per capita gross domestic product (GDP), which is a common measure of local productivity.

There is some negative correlation, meaning that tighter cultures tend to have somewhat lower productivity, but the relationship is not that strong. For example, Maine, a relatively loose state, has a lower per capita GDP, while Texas, a relatively tight state, has a higher per capita GDP. Oregon has a far lower per capita GDP than Washington, in spite of being slightly looser.
Figure 7 shows the correlation of tight/loose with per capita personal income, a broader measure of economic success.

Here the correlation is higher. Personal income includes not just wages, but also investment income, so gives some indication of wealth and income producing assets. Note that the correlation pattern is strongest on the right side of the chart, where incomes are highest. Middle and lower income states cover a range of loose and tight, but highest incomes states are all relatively loose.
Looking ahead
Washington state is among the loosest states in the country. It is safe to say that if the survey were confined to the Seattle area, the looseness score would be even lower. The state’s historic low rates of religiosity, and its high rate of in-migration of well-educated people indicates that the state will probably remain low on the tight/loose spectrum for some time to come.
Discover more from Post Alley
Subscribe to get the latest posts sent to your email.
Fascinating analysis. How would it look for Washington State if broken down by county? Would the East and West have different levels of looseness or tightness?
Interesting indeed. This, together with A.G. Barr’s declaring Seattle, Portland and New York “anarchist jurisdictions,” recalls something George W. Bush said (wrongly, but forget that for the moment) after 9-11: “They hate our freedoms.”